| |
|
Information
|
| |
| |
| Time bound histograms |
|
|
| Bound1 | 75.15% < 1 |
| Bound2 | 93.88% < 2 |
|
|
In this histogram, response time measurements are grouped into three categories:
| Green: |
The percentage of response times shorter than the value for time bound 1. |
| Yellow: |
The percentage of response times longer than the value for time bound 1, but shorter than the value for time bound 2. |
| Red: |
The percentage of response times longer than the value for time bound 2. |
|
In the example above,
75% of the response times are shorter than time bound 1, these response times may be considered fully satisfactory;
19% of the response times are between time bound 1 and time bound 2, these response times may be considered slightly problematic, but still acceptable;
6% of the response times are longer than time bound 2, these response times have to be considered seriously problematic.
|
|
You can set the default time bounds for response time measurements via the user interface: From the SilkPerformer menu bar, select Settings/Active Profile. In the ensuing dialog, click the Replay category, and then the Results icon. In the Timer statistics area of the General tab, specify the time bounds, in 1/100 seconds.
Additionally, you can set time bounds individually in your test script by calling the MeasureSetBound function.
|
|
| Response time breakdown histograms |
|
|
| average page time[s] | 3.30 |
| average document download time[s] | 2.77 |
| average server busy time[s] | 1.21 |
|
|
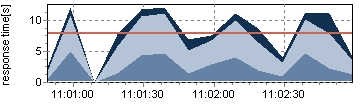
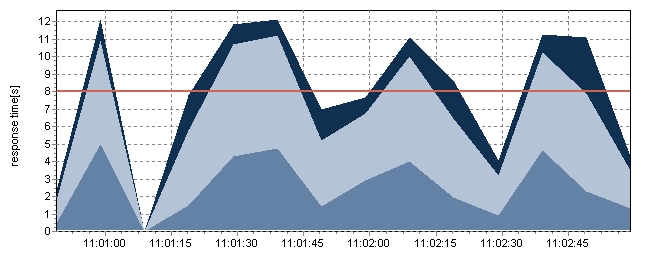
In this histogram, response times for Web pages are subdivided into server-busy times, document-downloading times, and round-trip times. Response times for Web forms are subdivided into server-busy times and round-trip times.
In the example, the histogram illustrates that the server busy time makes up 36% (1.21/3.30) of the overall Web page response time. The document downloading-time makes up 84% (2.77/3.30) of the overall response time.
|
| |
|
| |
| |
| |
|
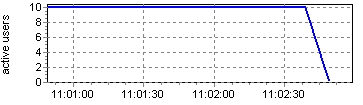
VUser
|
| |
| |
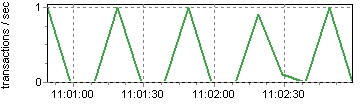
| Transactions |
The transactions measurement group contains response time information about transactions. For each transaction defined in your load test script, a group of measurements is created; the name of the transaction is used as the key for the measurements. The histogram enables you to easily check whether or not the transactions response times meet the response time requirements.
|
| Name |
Count |
Measured |
Total |
Min |
Avg |
Max |
StdDev |
Bound1 |
Bound2 |
Histogram |
#Overall Response Time# |
| Trans. ok[s] |
50 |
50 |
1,304.120 |
0.000 |
26.082 |
37.224 |
13.141 |
20.00%<1 |
20.00%<2 |
|
TINIT |
| Trans. ok[s] |
10 |
10 |
0.000 |
0.000 |
0.000 |
0.000 |
0.000 |
100.00%<1 |
100.00%<2 |
|
TMAIN |
| Trans. ok[s] |
40 |
40 |
1,304.120 |
28.481 |
32.603 |
37.224 |
1.806 |
0.00%<1 |
0.00%<2 |
|
|
| Web forms |
The Web form measurement group contains measurements related to Web forms declared in the load-testing script. The Web form measurement group provides response time measurements and throughput rates for form submissions with the POST, GET, and HEAD methods. For each form declared in the test script, a measurement group is created; the name of the form is used as the key to the measurement group created.
|
| Name |
Count |
Measured |
Total |
Min |
Avg |
Max |
StdDev |
Bound1 |
Bound2 |
Histogram |
FORM1001 |
|
response time breakdown (network / server)
|
|
| Round trip time [s] |
40 |
40 |
150.317 |
0.871 |
3.758 |
4.967 |
0.840 |
100.00%<8 |
100.00%<16 |
|
| Server busy time[s] |
40 |
40 |
33.123 |
0.210 |
0.828 |
1.292 |
0.250 |
77.50%<1 |
100.00%<2 |
|
| Hits |
40 |
40 |
40.000 |
1.000 |
1.000 |
1.000 |
0.000 |
|
|
|
| Request data sent[kb] |
40 |
40 |
18.745 |
0.466 |
0.469 |
0.470 |
0.001 |
|
|
|
| Response data received[kb] |
40 |
40 |
413.652 |
10.330 |
10.341 |
10.346 |
0.000 |
|
|
|
|
| Page timers |
The page timer measurements group contains measurements related to Web pages that are downloaded by a virtual user. For each Web page that is downloaded, a measurement group is created; the title of the Web page is used as the key to the measurement group created.
|
| Name |
Count |
Measured |
Total |
Min |
Avg |
Max |
StdDev |
Bound1 |
Bound2 |
Histogram |
#Overall Response Time# |
|
response time breakdown (server / document / page)
|
|
| Page time[s] |
160 |
160 |
1,303.940 |
1.051 |
8.150 |
17.525 |
5.005 |
50.00%<8 |
96.88%<16 |
|
| Document download time[s] |
160 |
160 |
1,044.533 |
0.871 |
6.528 |
13.138 |
3.705 |
36.88%<4 |
52.50%<8 |
|
| Server busy time[s] |
160 |
160 |
356.347 |
0.210 |
2.227 |
7.630 |
1.683 |
43.75%<1 |
49.38%<2 |
|
Bar Code Spielwiese: Demonstration der serverseitigen Barcode Generierung mit T |
|
response time breakdown (server / document / page)
|
|
| Page time[s] |
40 |
40 |
157.620 |
1.051 |
3.941 |
5.067 |
0.790 |
100.00%<8 |
100.00%<16 |
|
| Document download time[s] |
40 |
40 |
150.317 |
0.871 |
3.758 |
4.967 |
0.840 |
52.50%<4 |
100.00%<8 |
|
| Server busy time[s] |
40 |
40 |
33.123 |
0.210 |
0.828 |
1.292 |
0.250 |
77.50%<1 |
100.00%<2 |
|
Barcode Software (ActiveX, DLL, SAP R/3, Host-Solutions) |
|
response time breakdown (server / document / page)
|
|
| Page time[s] |
40 |
40 |
459.902 |
9.174 |
11.498 |
13.269 |
0.922 |
0.00%<8 |
100.00%<16 |
|
| Document download time[s] |
40 |
40 |
415.215 |
8.382 |
10.380 |
11.917 |
0.805 |
0.00%<4 |
0.00%<8 |
|
| Server busy time[s] |
40 |
40 |
178.240 |
3.076 |
4.456 |
5.498 |
0.563 |
0.00%<1 |
0.00%<2 |
|
Barcode Software, ActiveX, SAP R/3, DLL (VB,VC,C++), Label & Form Printing, Str |
|
response time breakdown (server / document / page)
|
|
| Page time[s] |
40 |
40 |
574.461 |
12.568 |
14.362 |
17.525 |
1.325 |
0.00%<8 |
87.50%<16 |
|
| Document download time[s] |
40 |
40 |
389.631 |
6.869 |
9.741 |
13.138 |
1.242 |
0.00%<4 |
10.00%<8 |
|
| Server busy time[s] |
40 |
40 |
119.543 |
2.314 |
2.989 |
7.630 |
0.815 |
0.00%<1 |
0.00%<2 |
|
Barcode Software, barcode activex, OCX, Label, DLL, Code39, Code128, UPC, EAN, |
|
response time breakdown (server / document / page)
|
|
| Page time[s] |
40 |
40 |
111.957 |
1.833 |
2.799 |
6.499 |
0.901 |
100.00%<8 |
100.00%<16 |
|
| Document download time[s] |
40 |
40 |
89.370 |
1.232 |
2.234 |
5.748 |
0.863 |
95.00%<4 |
100.00%<8 |
|
| Server busy time[s] |
40 |
40 |
25.441 |
0.231 |
0.636 |
3.615 |
0.499 |
97.50%<1 |
97.50%<2 |
|
| |
|
| |
| |
|